Quick Facts
- Category: Health & Medicine
- Published: 2026-05-04 12:42:33
- How to Set Up Amazon WorkSpaces for AI Agents: A Step-by-Step Guide
- Swift 6.3 and Community Highlights: Q&A Deep Dive
- How to Spot Malicious Impersonations on Hugging Face: Lessons from the OpenAI Privacy Filter Scam
- 10 Surprising Bottlenecks You'll Encounter When Self-Hosting LLMs (GPU Isn't the Only Hurdle)
- 10 Crucial Facts About 'Forever Chemicals' in Baby Formula: Understanding the FDA's Latest Findings
Introduction
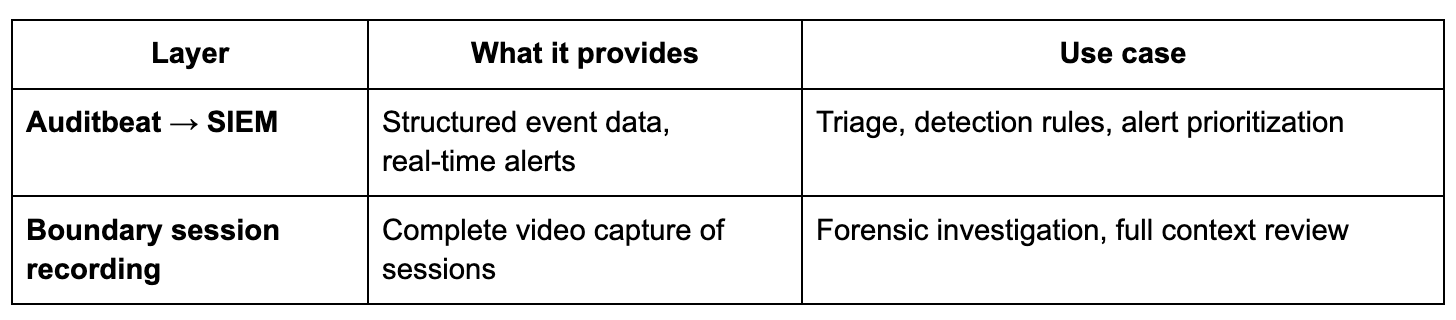
In regulated industries like finance, healthcare, and critical infrastructure, monitoring privileged access is not just good practice—it's a compliance necessity. Regulations such as SOX, PCI DSS, DORA, and HIPAA demand detailed activity logging, robust audit trails, and the ability to detect suspicious behavior in real time. HashiCorp Boundary excels at identity-based access control, session brokering, and recording privileged sessions. However, security operations centers (SOCs) need more than video recordings; they need structured, searchable event data that triggers alerts automatically. This guide shows you how to combine Boundary's session recordings with kernel-level audit events from Elastic's Auditbeat to build a comprehensive, production-ready monitoring stack. You'll get real-time detection in your SIEM plus deep forensic video evidence for investigations.
What You Need
- HashiCorp Boundary (version 0.12 or later) deployed with session recording enabled on a target host.
- Elastic Stack (Elasticsearch, Kibana, and optionally Logstash) – we recommend Elastic Cloud or a self-managed cluster with at least 8 GB RAM for basic workloads.
- Auditbeat – Elastic's lightweight shipper for audit data (part of the Elastic Beat family).
- Privileged target hosts – Linux servers (SSH or RDP) that users access through Boundary. Ensure they have network connectivity to both Boundary and your Elastic cluster.
- Root or sudo access on target hosts to install Auditbeat and configure kernel audit rules.
- SIEM module in Kibana (Elastic Security app) for detection rules and alerts.
Step-by-Step Guide
Step 1: Enable Boundary Session Recording on Target Hosts
Before capturing audit events, ensure Boundary records the privileged sessions themselves. If you haven't already, configure a credential store and a target with session recording turned on. In Boundary's admin console or via CLI, set the target's session recording mode to always. Verify recording by initiating a test session, then checking the stored recordings in Boundary's storage (e.g., S3, Azure Blob, or local disk). This step ensures that after an alert fires, you can replay the exact session.
Step 2: Install and Configure Auditbeat on Each Target Host
Auditbeat runs as a daemon on your Linux targets. Install using the official Elastic repositories or download the package. Example for Debian/Ubuntu:
curl -fsSL https://artifacts.elastic.co/GPG-KEY-elasticsearch | sudo apt-key add -
echo "deb https://artifacts.elastic.co/packages/8.x/apt stable main" | sudo tee /etc/apt/sources.list.d/elastic-8.x.list
sudo apt-get update && sudo apt-get install auditbeat
Next, edit /etc/auditbeat/auditbeat.yml. Set the output to your Elasticsearch cluster (API key or username/password). Enable the auditd module and configure rules to capture high-value events like file access (/etc/shadow), privilege escalation (sudo), and network reconnaissance (netstat, ss). Example module config:
auditbeat.modules:
- module: auditd
  audit_rule_files:
  - '${path.config}/audit.rules.d/*.conf'
  severity: info
Create a custom rules file at /etc/auditbeat/audit.rules.d/custom.conf:
-w /etc/shadow -p wa -k shadow_access
-a always,exit -F arch=b64 -S execve -F euid=0 -k privilege_escalation
-a always,exit -F arch=b64 -S connect -S bind -F key=network_tools
Start and enable Auditbeat:
sudo systemctl enable auditbeat --now
Step 3: Verify Auditbeat Data is Reaching Elasticsearch
Check the Auditbeat logs for errors. Then, in Kibana, go to Stack Management > Index Patterns and create an index pattern for auditbeat-*. Confirm events appear by navigating to Discover and selecting the pattern. You should see structured events with fields like audit.log.*, process.*, and file.*. If data is missing, revisit firewall rules, authentication, and Auditbeat configuration.
Step 4: Create Detection Rules in Elastic Security
Now that audit events flow into your SIEM, define rules to spot suspicious behavior. In Kibana, open the Security app, go to Rules, and click Create new rule. Use a Custom query to match events. For example, to detect access to /etc/shadow:
event.module: "auditd" AND file.path: "/etc/shadow" AND audit.log.op: "watched"Set the rule's severity, risk score, and action (e.g., send email, post to webhook). For real-time alerts, choose a Machine Learning or Threshold rule if needed. Test the rule by performing the suspicious action on the target host. Within seconds, Kibana should generate an alert.
Step 5: Correlate Alerts with Boundary Session Recordings
When an alert fires, you need to identify which Boundary session to review. To enable correlation, ensure Auditbeat enriches events with the Boundary session ID. One method: set an environment variable (e.g., BOUNDARY_SESSION_ID) in the user's shell session via Boundary's session-specific environment variables (available in Boundary Enterprise). Alternatively, use a custom log parser to pull the session ID from Boundary's audit logs and correlate on timestamp and host. Once you have the session ID, open Boundary's UI or API, navigate to the recorded session, and replay the video. This gives you full context: what the user typed, saw, and responded to.
Step 6: Optimize and Iterate
No detection strategy is perfect out of the box. Monitor false positives by tuning rule queries and adjusting audit rules. Use Kibana dashboards to visualize trends—e.g., top users accessing sensitive files, peak times for privilege escalation. Add additional Auditbeat modules for file_integrity, system, or process monitoring as needed. Finally, document runbooks that combine your SIEM alerts with Boundary session replay workflows.
Tips for Success
- Start with minimal audit rules – Over-auditing can overwhelm your Elastic cluster. Focus on high-risk actions: sensitive file access, privilege escalation, network scanning tools.
- Use tags and metadata – Tag Boundary targets and Auditbeat modules with identifiers like
productionorpci-zonefor easier filtering. - Test your alert chain regularly – Simulate real attacks (e.g., using penetration testing tools) to validate that alerts fire and session recordings are accessible.
- Secure your audit pipeline – Use TLS between Auditbeat and Elasticsearch, and rotate API keys. Store session recordings in immutable storage for compliance.
- Leverage Elastic's machine learning – Enable ML jobs for “Unauthorized Access Attempts” to detect anomalies beyond static rules.
- Consider compliance requirements – For SOX or PCI DSS, ensure you can demonstrate the full chain: from alert to video evidence with timestamps.